
480 words
2 minutes
Ubuntu 22.04+Vscode配置 R 环境
安装 R
通过conda安装R环境
conda config --add channels conda-forgeconda create -n R python=3.10conda install -c conda-forge r-baseconda activate R安装radian交互式R环境
pip install radian通过在命令行中通过R启动交互界面,并安装language server,httpgd和rmarkdown包
install.packages("languageserver")install.packages("httpgd")install.packages("rmarkdown")安装绘图用的R包ggplot2
install.packages("ggplot2")输入以下代码验证是否安装成功
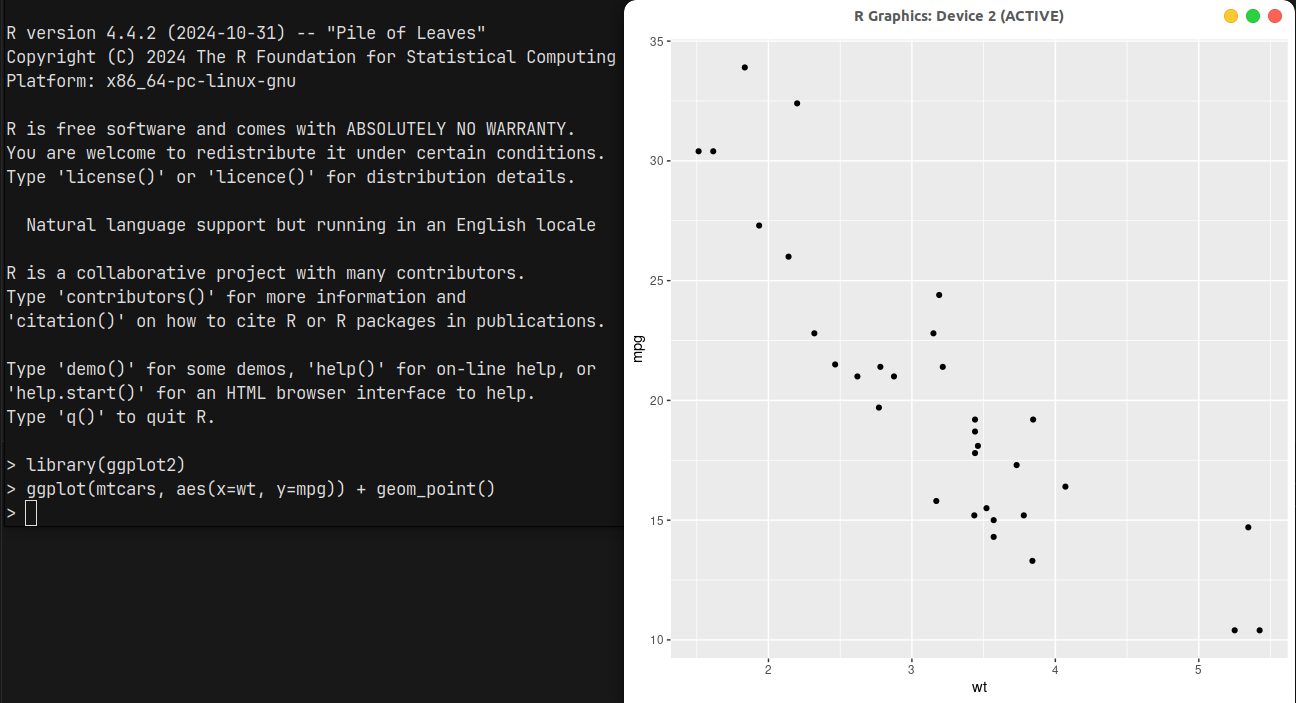
library(ggplot2)ggplot(mtcars, aes(x=wt, y=mpg)) + geom_point()如果出现绘图结果则说明安装成功
配置Vscode
在Vscode中安装R,R Debugger,R Markdown All in One插件


配置radian为终端,在Vscode设置中搜索r.rterm.ubuntu,填写为radian的路径(可以在conda环境中通过which radian获取)

搜索R.backetend并勾选

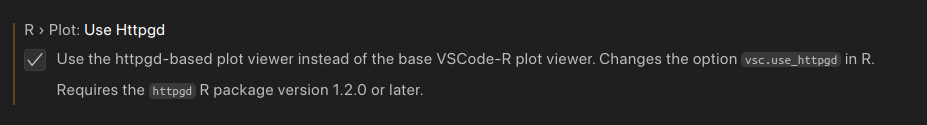
在设置中搜索R.httpgd并勾选
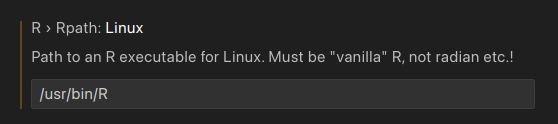
最后搜索r.rpath.linux并填写R的路径(可以在conda环境中通过which R获取)
测试
新建一个test.r文件,将以下内容复制进去
library(ggplot2)
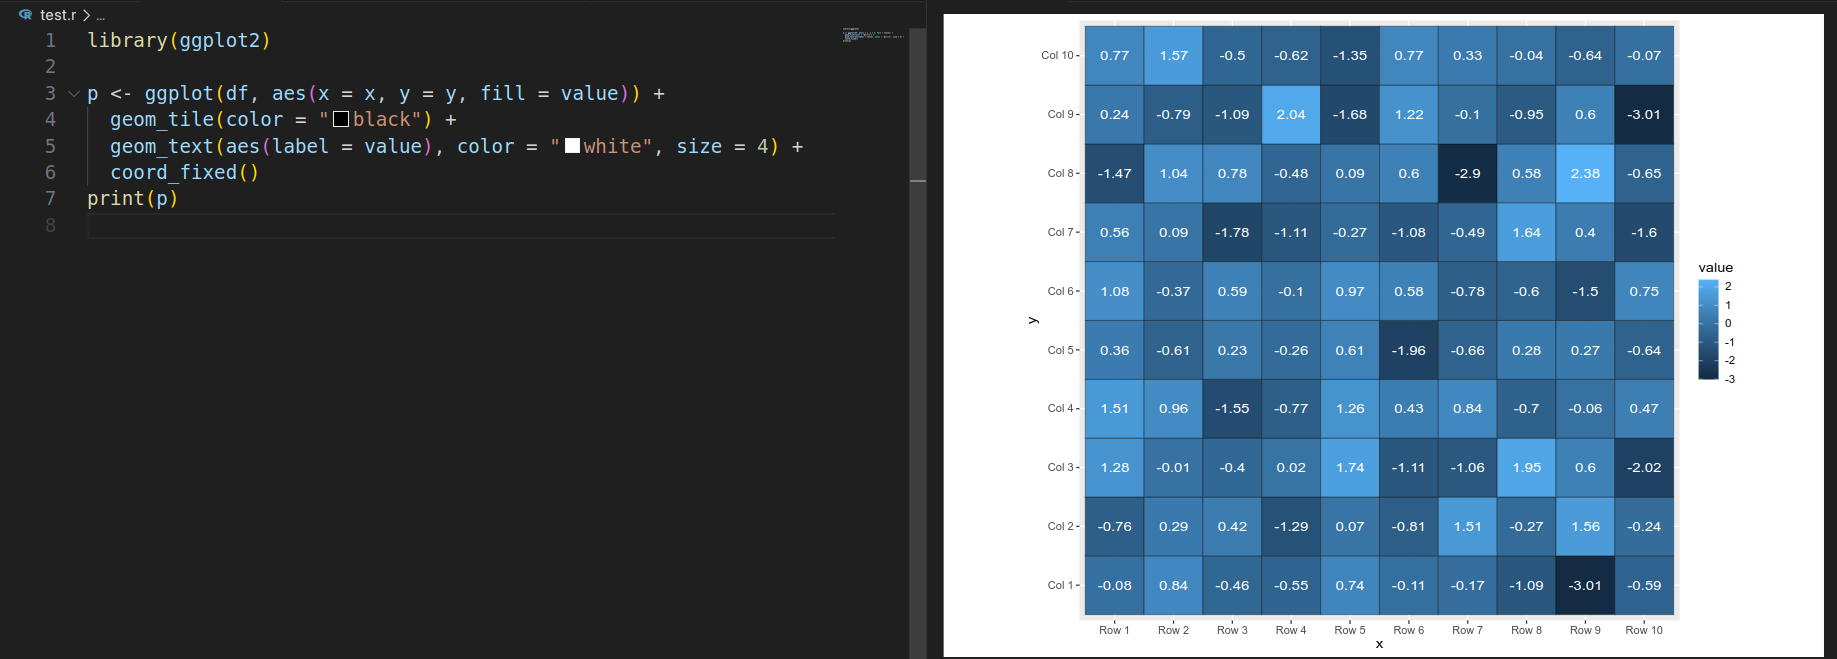
p <- ggplot(df, aes(x = x, y = y, fill = value)) + geom_tile(color = "black") + geom_text(aes(label = value), color = "white", size = 4) + coord_fixed()print(p)按Ctrl+Shift+S运行代码,如果出现绘图结果则说明配置成功
新建一个test.rmd文件,将以下内容复制进去
### hello world in R Markdown```{r}library(ggplot2)
# Dataset.seed(1)df <- data.frame(x = rnorm(200), y = rnorm(200))
ggplot(df, aes(x = x, y = y, fill = ..level..)) + stat_density_2d(geom = "polygon")```
```{r}ggplot(cars, aes(x = speed, y = dist)) + geom_point()```
#### 生成一组随机数```{r}set.seed(1)x <- rnorm(100)```
#### 绘制直方图```{r}hist(x)```
#### 绘制散点图```{r}y <- rnorm(100)plot(x, y)```
```{r fig.width=6, fig.height=4}plot(x, y)```按Ctrl+Shift+P选择R Markdown: Open Preview,如果能够正常显示则说明配置成功
Ubuntu 22.04+Vscode配置 R 环境
https://astronaut.github.io/posts/r-installation/